The Post-Pandemic Attendance Reset: Why 1.5 Visits Per Week Is the New Normal and What It Means for Your Revenue Model
Gym members used to show up 2.1 times per week. They now show up 1.5 times. That 29% decline isn’t recovering — and it changes what a Hotworx studio is actually selling.
Introduction
Every Hotworx investor who’s done due diligence knows the unit economics. Revenue per member, break-even member count, churn rate assumptions. But almost none are adjusting for the single biggest behavioral change in fitness consumer behavior since the pandemic:
Average gym/studio visit frequency dropped from 2.1 per week (2019) to 1.5 per week (2024–2026) — and it’s not recovering.
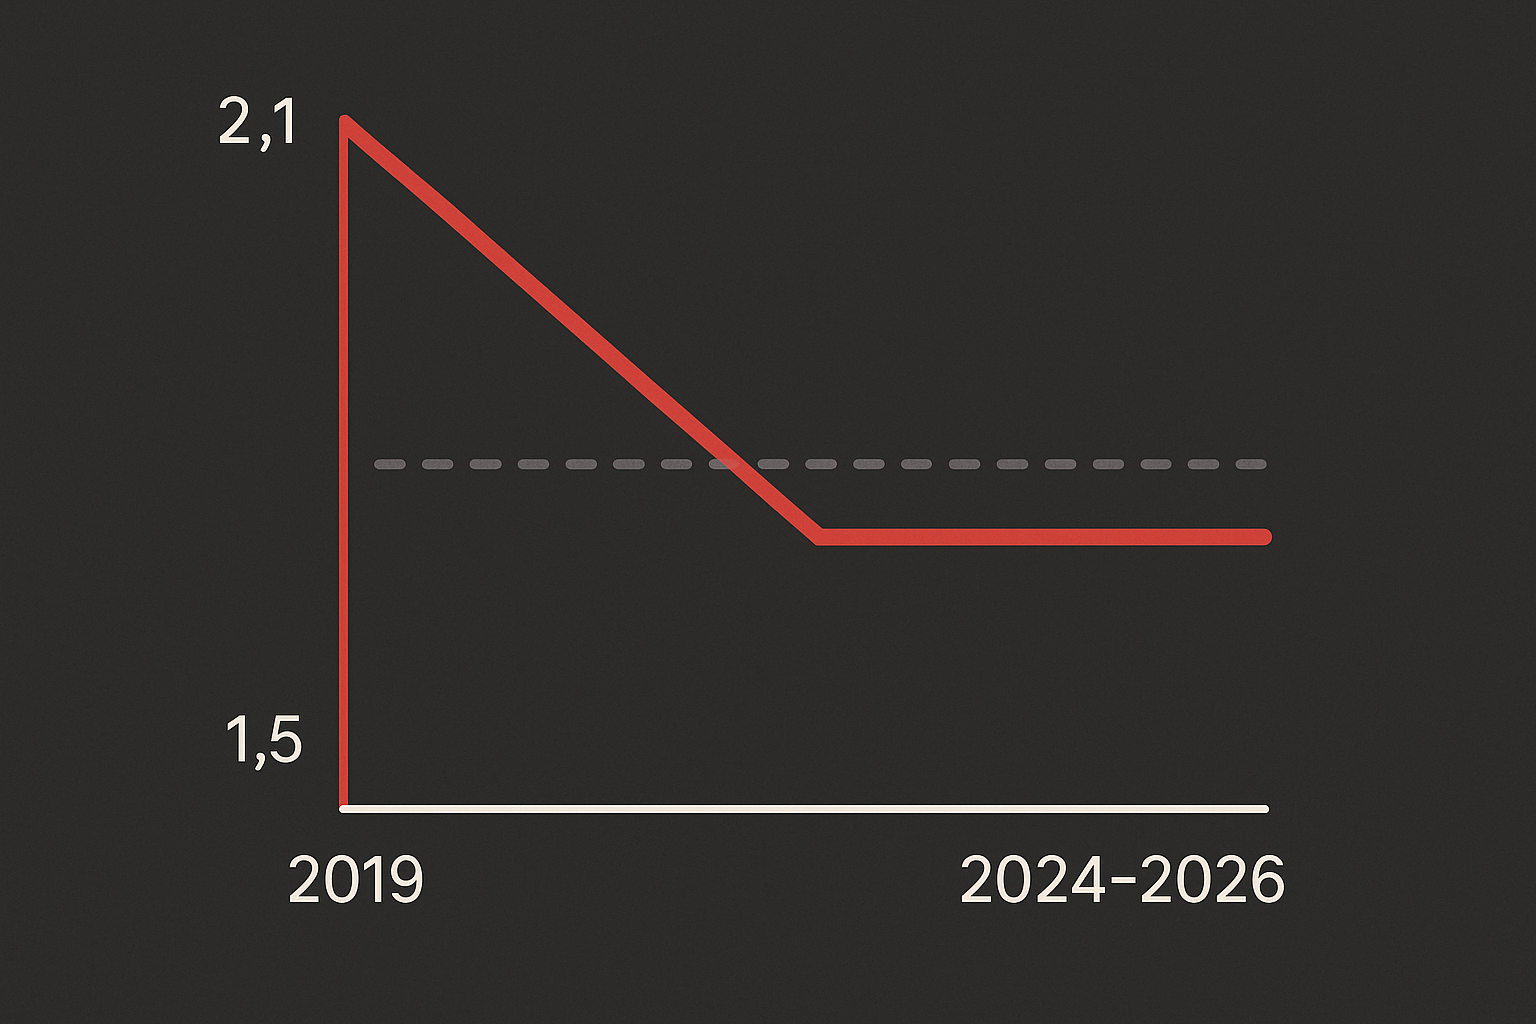
This isn’t a temporary COVID hangover. Attendance frequency data from the HFA 2025 Fitness Industry Benchmarking Report shows the 1.5 visit/week average has been stable for over 18 months. The decline happened rapidly (2020–2022) and then plateaued. We’re not in a recovery trend. We’re in a new baseline.
For a Hotworx franchisee, this creates a modeling problem that cuts both ways — and understanding which edge dominates is the difference between a sound investment and a miscalibrated one.
Why Visits Permanently Declined
The pre-pandemic fitness member averaged 2.1 visits/week because the gym was a destination with limited alternatives. Post-pandemic, three structural shifts compressed visit frequency:
1. The Home Fitness Residual
Not Peloton specifically — but the broader behavioral discovery that exercise doesn’t require a dedicated facility. Even members who returned to studios now supplement with home workouts, outdoor exercise, or digital content. The studio gets fewer of their weekly sessions because it’s no longer the only option.
2. The Hybrid Schedule Effect
Remote and hybrid workers no longer have a commute-anchored routine that included stopping at the gym. The “on the way home” trigger disappeared for millions. Members now must make a separate trip specifically for the studio — a higher friction action that reduces frequency.
3. The Wellness Diversification
Members who previously concentrated 3–4 weekly exercise sessions at one facility now split between yoga, strength, walking groups, and recovery services. The boutique studio gets 1–2 of those sessions instead of 3–4.
The gym membership statistics confirm: these shifts are structural, not cyclical. 2026 boutique fitness attendance data shows the same pattern across every studio format. None of these shifts are reversible. They represent permanent changes in how fitness consumers organize their time and spend.
The Good News: Lower Utilization Means Lower Costs
For most fitness businesses, member attendance is a pure cost driver: every visit consumes resources (instructor time, equipment wear, facility cleaning, energy). A member who visits 3x/week costs more to serve than one who visits 1x/week — but both pay the same monthly EFT.
Hotworx amplifies this dynamic because of its specific cost structure:
Utility Costs Are Visit-Driven
Infrared saunas consume significant electricity — estimates range from $1,500–$3,000/month depending on pod count and session hours. Fewer member visits = fewer sessions running = lower electricity consumption. A 29% decline in visit frequency translates to meaningful utility cost savings.
Equipment Degradation Is Usage-Dependent
Sauna heating elements, rowing machines, cycle components, and yoga mats all degrade proportional to use. Lower visit frequency extends the useful life of your $60K–$120K equipment stack, pushing your year-5 replacement capex further into the future.
Capacity Ceiling Expands
At 1.5 visits/week, your 8–10 sauna pods can serve more total members before hitting scheduling conflicts. A member who comes 1.5x/week occupies a pod 78 minutes weekly (assuming 52-minute average sessions). At 2.1x/week, that member consumes 109 minutes. The math:
- At 2.1 visits/week: each pod supports ~29 members during peak hours (14 hours/day × 60 min / 109 min per member-week)
- At 1.5 visits/week: each pod supports ~41 members during peak hours
That’s a 41% increase in theoretical member capacity PER POD from the attendance decline alone. If you have 10 pods, you can support ~410 members at 1.5x/week versus ~290 at 2.1x/week — without any physical expansion.
The Bad News: Attendance Frequency Is the #1 Churn Predictor
Here’s where the advantage reverses. Industry research from 2026 is unambiguous about the relationship between visit frequency and cancellation:
| Weekly Visits | Annual Retention Rate |
|---|---|
| 3+ per week | 85–90% |
| 2 per week | 65–75% |
| 1 per week | 40–50% |
| <1 per week | 15–25% |
The relationship is nearly linear: every reduction in weekly visits corresponds to a 15–25 percentage point decline in retention.
At the new 1.5 visits/week AVERAGE, here’s what the distribution likely looks like:
- ~20% of members visit 3+/week → 85–90% annual retention
- ~25% visit 2x/week → 65–75% annual retention
- ~30% visit 1x/week → 40–50% annual retention
- ~25% visit <1x/week → 15–25% annual retention
Blended annual retention at this distribution: approximately 50–55%.
That means you’re replacing roughly HALF your membership base every year — not because your product is bad, but because post-pandemic behavior means most members simply don’t visit enough to form the habit that retains them.
The Unmanned Model’s Structural Blind Spot
Staffed studios have a retention intervention mechanism: when a regular drops from 3x/week to 1x/week, a front desk employee or instructor notices. They text the member. They ask if everything’s okay. They rebook a session. This human touch is the industry’s primary churn-prevention tool.
Hotworx’s unmanned model can’t replicate this. The SAIL POS system tracks check-ins, but there’s no mechanism for proactive, personal outreach when attendance declines. The member stops coming and — in a 24-hour unmanned studio — nobody notices until the cancellation request arrives.
At 2.1 visits/week (pre-pandemic baseline), the gap between a member’s last visit and their cancellation decision was shorter. They’d miss 4–5 days, then feel the pull to return. At 1.5 visits/week, members routinely go 5–7 days between visits. The line between “normal pattern” and “disengaging” is invisible without proactive tracking and intervention.
This is the crux of the modeling problem: lower attendance saves you money per-member-served but accelerates the rate at which you LOSE members. Which effect is larger?
Running the Numbers Both Ways
Scenario A: Utility Savings Dominate (Optimistic)
Assumptions:
- 400 members at $59/month = $283,200 annual revenue
- Lower visit frequency reduces utilities by $4,800/year and extends equipment life by 2 years
- Churn runs at 55% annually (industry average at 1.5 visits/week)
- Member acquisition cost: $100/member
- Annual replacement cost: 220 members × $100 = $22,000
Total annual savings from lower attendance: ~$4,800 (utilities) + ~$6,000 (deferred capex annually) = $10,800
Total annual cost of higher churn vs. 2.1x/week baseline: 220 members replaced × $100 = $22,000 vs. 140 members at higher-frequency retention = $14,000. Incremental cost: $8,000.
Net effect: approximately +$2,800/year — the savings narrowly outweigh the churn cost.
Scenario B: Churn Cost Dominates (Pessimistic)
Assumptions:
- Same revenue base
- Churn runs at 60% annually (below-average retention due to no intervention mechanism)
- Member acquisition cost rises to $130 as market saturates
- Utility savings same as above
Total annual cost of churn: 240 members × $130 = $31,200 vs. 160 members at pre-pandemic frequency = $20,800. Incremental cost: $10,400.
Total savings: $10,800.
Net effect: approximately −$400/year — effectively a wash, with all the execution risk on the churn side.
What This Means
The attendance reset is NOT catastrophic for Hotworx’s model — it’s closer to neutral. The operational savings from lower per-visit costs roughly offset the higher churn cost. But this means your MARKETING EXECUTION determines profitability far more than your operational efficiency. You’re on a replacement treadmill where falling behind on member acquisition by even one month creates a revenue hole that compounds.
How to Adjust Your Pro Forma
If your financial model uses pre-pandemic attendance assumptions (most franchise sales presentations do), here’s how to recalibrate:
1. Churn Rate
Model 50–60% annual churn, not the 30–40% that may appear in optimistic franchise presentations. At $59/month, every 1% of churn represents ~$2,800 in lost annual revenue per 400-member base.
2. Marketing Spend
Budget 12–15% of revenue for member acquisition, not 8–10%. You’re replacing more members more often. The marketing budget isn’t discretionary — it’s the cost of maintaining flat revenue.
3. Capacity Planning
The good news: at 1.5 visits/week, you can serve more members per pod. Model 400–450 members at capacity rather than 280–320. This means your revenue ceiling is HIGHER than pre-pandemic assumptions — you just need to maintain marketing velocity to fill that capacity.
4. Break-Even Timeline
If members are less retained, your ramp-up period takes longer because you’re losing early members while still acquiring. Model 14–18 months to stable cash flow rather than 10–12.
5. Intervention Technology
Ask during validation: is Hotworx corporate developing automated attendance-triggered outreach? An automated text when a member hasn’t checked in for 7+ days would be a low-cost intervention that could shift retention 5–10 percentage points. If it doesn’t exist, model without it. If it’s in development via TrainingTRAX, factor it as potential upside.
The Bottom Line
The post-pandemic attendance reset isn’t a crisis for Hotworx — it’s a modeling adjustment. The unmanned, low-cost model is LESS vulnerable to the attendance decline than staffed studios (where every unused visit still costs instructor time). But it’s MORE vulnerable to the churn acceleration that low attendance creates (because there’s no human intervention mechanism).
The net effect is roughly neutral, which means your investment thesis needs to stand on OTHER fundamentals: market selection, marketing execution, and your personal capacity to manage member acquisition as a continuous process rather than a launch-and-coast operation.
If your model assumes “get to 350 members and maintain” — it’s wrong. The correct model is “get to 350 members and continuously replace 175–210 of them every year while staying ahead of the treadmill.” Budget accordingly.
Members don’t ghost because your studio failed them. They ghost because 1.5 visits per week is the new normal — and the gap between “regular member” and “about to cancel” has never been thinner. Your model needs to price in the cost of running faster just to stay in place.
This analysis is editorially independent and not affiliated with, endorsed by, or sponsored by Hotworx or any franchise system.